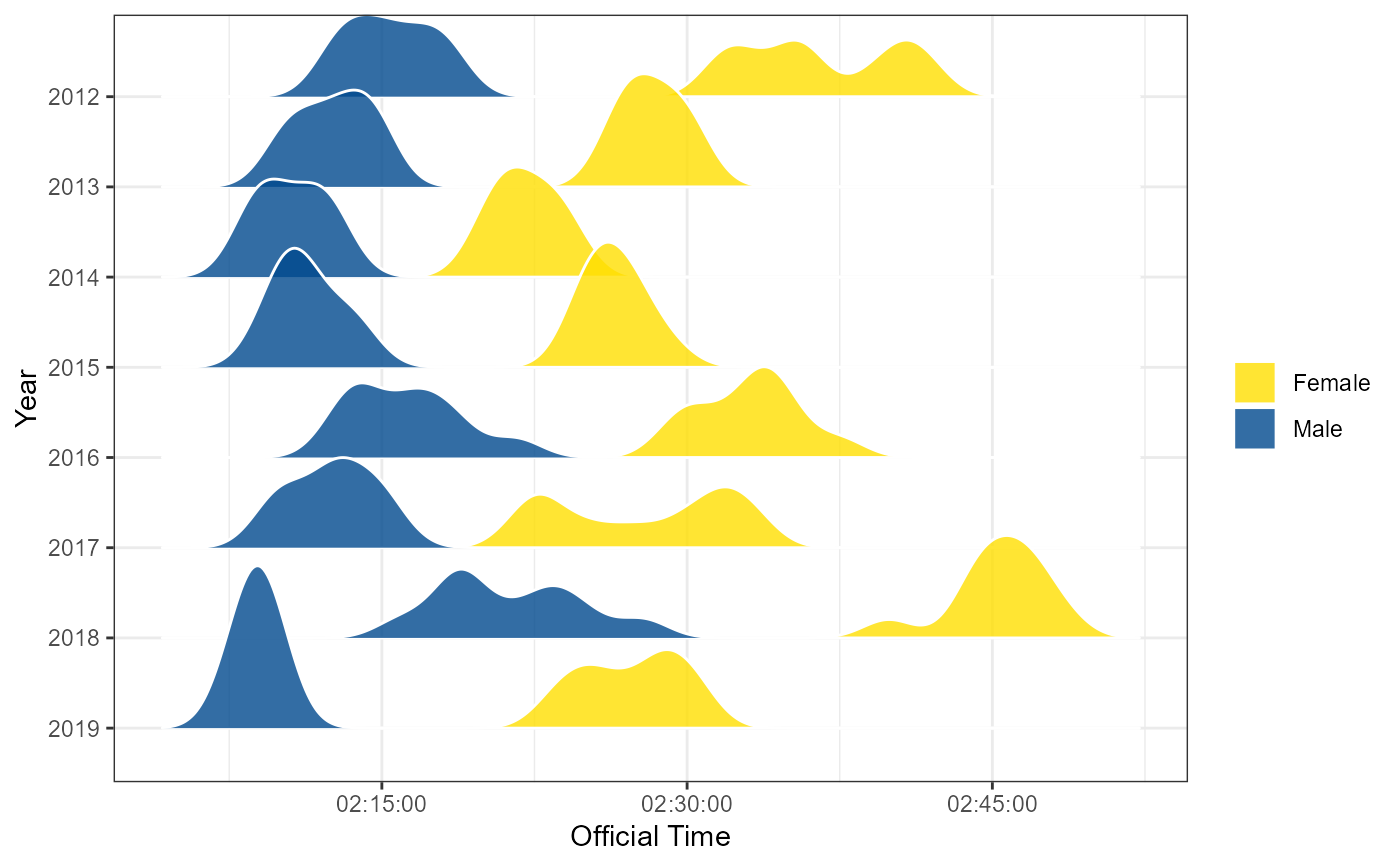
Plot density of participants over finishing time in Boston Marathon.
Source:R/boston_density_ridges.R
boston_density_ridges.RdThe boston_density_ridges() function uses the results_boston database to plot a density plot (based on the package "ggridges") of finishing times of Boston Marathon from 2009 to 2022. This function needs at least two years to for the graph to plotted properly.
Arguments
- year
Year when the event occured (string).
- range_position
Range of positions to be ploted (string).